Guided analysis activities step learners through the process of analyzing a complex situations. They answer one of the most important questions ever asked: “So what?”
 Analyze soil texture lets forestry professionals practice classifying soil textures based on the proportions of sand, loam, and silt in the soil.
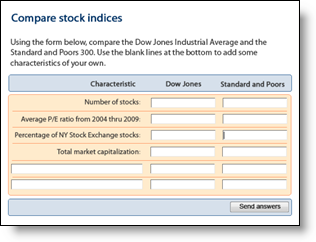 Evaluating complex data is …. well, complex. One way of simplifying it is to guide learners in comparing alternatives. The easiest way to do this in e-learning is to have learners create a side-by-side comparison.
In this example, learners compare two
major indexes of the stock markets in
the United States.
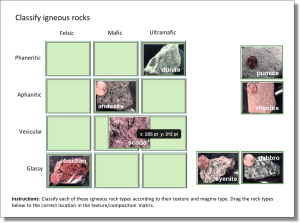 Classify igneous rocks lets learners practice classifying igneous rocks by their texture and magma type. To classify the rocks listed to the right, the learner drags each rock into a box in the appropriate row and column.
We have two versions of this example: One built in Apple’s Numbers and the other built in Microsoft Excel. Clicking either link below will download the spreadsheet or open it in the native application, if you have it. In either spreadsheet, just select and move the rock type onto the correct position in the matrix. For the answer, go to the answer worksheet. Numbers version. Excel version.
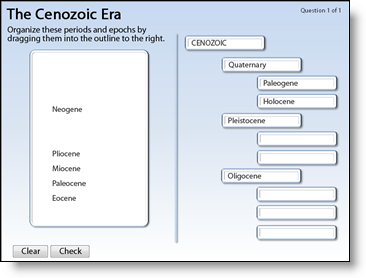 This example of guided analysis asks learners to organize the geologic periods and epochs of the Cenozoic Era into an indented list. The correct epoch indented beneath the correct period. To do so, learners drag a name from the left-side area and drop it into its correct place in the hierarchy to the right.
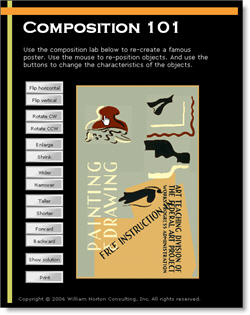 In Composition 101 learners are challenged to recreate a famous poster they have studied. They have all the pieces and must rearrange them by dragging pieces around, resizing them, and flipping them vertically and horizontally. The version to the left requires Flash. This link will open an HTML5 version of the activity.
About the examples
Analyze soil texture was built in PowerPoint, using iSpring Suite’s QuizMaker, and saved as HTML5. Classify igneous rocks was built in Apple Numbers and Microsoft Excel. Cenozoic Era was built using Adobe DCaptivate. And Composition 101 was built using Adobe Flash. The HTML 5 version was created by converting the Flash file in Google’s Swiffy.